Network Discovery Task
Considerations
Task Results
Discovered Devices Reports
Resource Manager
Network Discovery Task
After all the preliminary work is done, it is simple to run a Network Discovery. If an initial Discovery was run, you can kick off the same task again to now run the discovery with the proper classifications in place.
Steps to run through the discovery are listed here:
- In the Symantec Management Console browse under Manage > Jobs and Tasks > in the left-hand tree browse under System Jobs and Tasks > Discovery and Inventory > and select Network.
NOTE: You can create a Network Discovery Task from whatever location you wish within the Jobs and Tasks tree. The above is just a typical place to create such a task.
- Right-click on the containing folder and select New > Task.
- From the left-hand tree, locate the folder for Discovery and Inventory, and select Discover Network.
- Provide a name for the discovery, such as “Full Network Discovery”.
- From the Connection profile dropdown select the connection profile to use for this task.
- Configure the scan type, either Targeted (Ping), or ARP or seed device. This can be edited later after creating the Task. For this example I selected Seed Device (Scan network devices (ARP)).
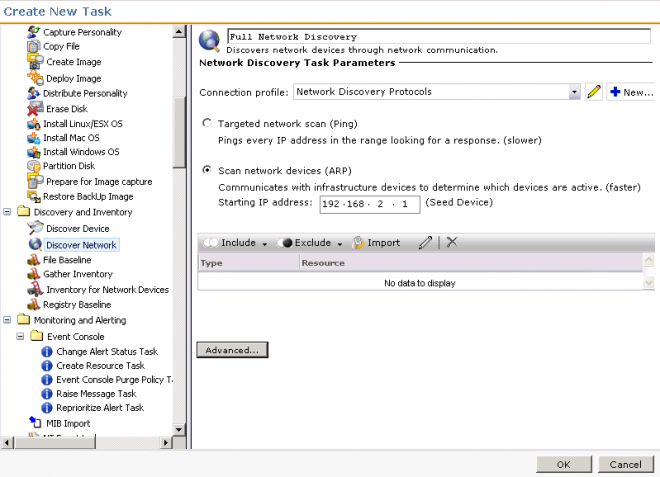
- Click OK to save the Task.
- In the main console the task will now load in the tree. The details will show within the right-pane.
- Check the considerations listed below before scheduling the discovery.
- Click the New Schedule option.
- If you choose the Now radial, the discovery will execute immediately. It can also be set to a Schedule to run during off-peak times, if that is required.
- Click the Schedule button.
- Done!
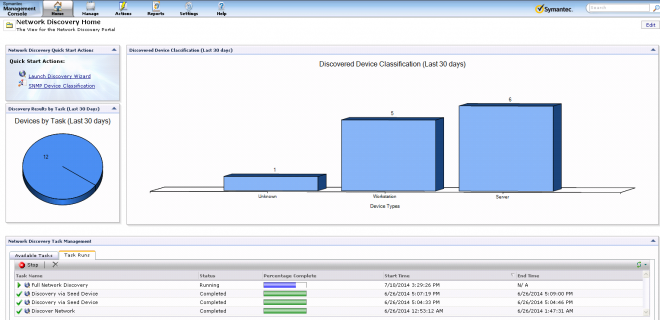
To check progress, in the Symantec Management Console browse under Home > Discovery and Inventory > and select Network Discovery. This will provide an overview of all Discoveries, but note that at the bottom webpart, under the Task Runs tab, there is a Percentage Complete, as shown in this screenshot:
Considerations:
- IP Ranges will take considering longer if a large range is included. We will start by pinging every IP Address, waiting for the timeout and executing the retry count. Take this into mind when scheduling a range.
- A huge range, such as a class B subnet, is not recommended. A class B subnet has thousands and thousands of IP Addresses in the range so a discovery will take a very, very long time.
- Find out what specific ranges are being leased on the network so that those ranges can be added.
- When selecting a Seed Device the ARP table, or every device and its IP that it knows about, will be used to check what IP Addresses to query against. Most Seed devices will provide what is directly connected to them, and will have the ARP tables of other routers and switches it knows about. This may create a very large discovery, so IP ranges may be needed in very large environments.
Task Results
When a task is complete, you can check the results by double-clicking on the scheduled line in the policy. This will bring up statistics for the task, including what new devices were discovered, what devices were updated, etc. The quick view allows you to know if things are completing as expected.
This shows a view of these statistics:
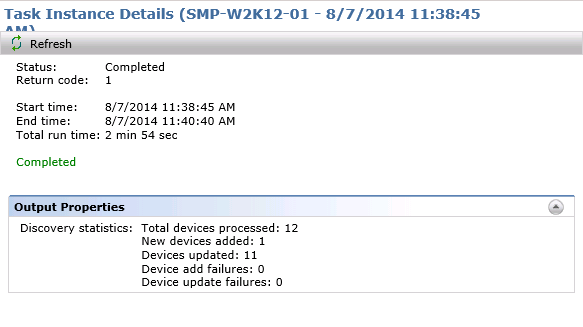
With this view you can determine:
- If the number of expected devices were seen (Total devices processed)
- Number of new devices found by the discovery (New devices added)
- What devices were already known to the Notification Server (Devices updated)
- Any failures, and the type (Devices add failures, Device update failures)
- How long the discovery took. The start and end times allow you to understand the impact of the discovery on the network, and how much time it took to go through the various protocols against found devices. Review the Considerations section for possible explanations of short or long times reported.
- Return code can help determine if something is wrong. If it is not a 1, generally something failed within the discovery and the logs should be checked.
- In the future, you can review the last time the scan ran. NOTE: This is important if troubleshooting problems with duplicate computer records, etc.
Discovered Devices Reports
The Discovered Devices report allows you to review all devices discovered via Network Discovery. The parameters allow you to see a holistic view, or narrow down to very specific results. The Parameters include:
- Date Range – Show devices discovered within a specific date range, from all those discovered regardless of task, method, or type, or narrow down further.
- Discovery Task – See the results for a specific Task, or leave at Any for all.
- Protocol – Select a specific Protocol if you want to see devices discovered specifically by that protocol. Any is typically the best option.
- Device Type – Refine the view to only include specific device types.
The following shows a typical display of this report:
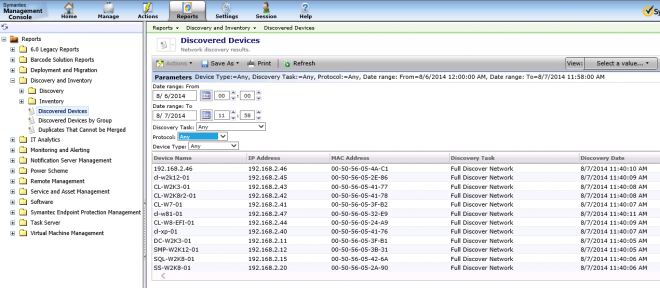
You can drill down into a network resource by double-clicking on the row. This will launch Resource Manager for that resource, which provides you a lot of information about what was discovered, what data gathered, etc.
Other reports provide good information as well. These reports include:
Discovery and Inventory > Discovery > Computers:
- Network Computers – Computers discovered by Network Discovery. For computers with records already in the Notification Server, Network Discovery appends Network-specific tables to the record.
- Novell NetWare Computers – Used to review data on Novell Netware systems.
Discovery and Inventory > Discovery > Devices:
- Chassis and Module – For devices such as blade enclosures or other multiple-device structures, you can view the chassis and included modules.
- Device Interfaces – For devices will multiple interfaces, this report provides data on them.
- Network Devices – A pie graph of all discovered devices by manufacturer, with the ability to drilldown.
- Network Routers – A report for routers.
- Network Switches – A report for switches
Discovery and Inventory > Discovery > Printers
- Network Printers – A report for printers
Discovery and Inventory > Discovery
- Discovered Devices by Group – Unlike the Discovered Devices report, this one displays in a pie graph, grouped by device type. The graph can be used to drill down into each type for a list.
- Duplicates That Cannot be Merged – Use this when troubleshooting duplicate device problems.
Another view of network devices by Resource Type can be viewed in the Symantec Management Console under Manage > All Resources > Asset > Network Resource > and all subgroups. These views do not filter on other criteria, including how the device came into the system. While Network Discovery reports are all based off of results from discovery tasks, the Resource views will show all, including those that came in via other methods such as Connector, AD Import, Domain Discovery, Asset Management.
Resource Manager
When reviewing what was captured on a system, the reports only provide partial information based on what the report is for. To get a full view, Resource Manager can be viewed. This can also help you understand what was captured, and if Agentless Inventory is needed to inventory additional details.
The most useful place in Resource Manager to look is the Inventory section. You can reach this by browsing under View > Inventory. The Inventory tree will appear in the middle pane. The pane is populated by data classes (typically understood as tables in the database), grouped by the type of data class. The following example shows where Network Discovery data is kept:
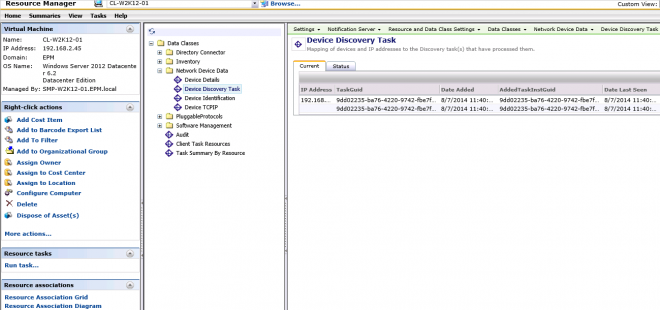
Note the following data classes and what useful information can be found therein:
- Device Details, Device Identification, Device TCP/IP – These data classes contain basic information for the device, and most devices discovered via Network Discovery will have these data classes present.
- Device Discovery Task – This contains the information for the Discovery Tasks that discovered this system, whether initially or with subsequent network scans.
- AeX AC Discovery – This basic inventory data class contains when the device was discovered, and what method was used. If Network Discovery was used, the Discovery Method will indicate such.
- SNMP% – The SNMP data classes contain specific SNMP data. SNMP Identification, for example, contains the SysObjectID of the device. This is useful when reviewing discovered devices and pulling the OID in order to properly classify a device.
Network Discovery and Agentless Inventory 7.1, 7.5 Best Practices and Troubleshooting, Part 1
Network Discovery and Agentless Inventory 7.1, 7.5 Best Practices and Troubleshooting, Part 2
Network Discovery and Agentless Inventory 7.1, 7.5 Best Practices and Troubleshooting, Part 4